Table of Contents
Cold email gmass open rates vary by industry from 38 percent (Marketing/Advertising) down to 21 percent (Government) based on 50,000 emails sent via GMass across 12 industries over 12 months. The overall median open rate is 28 percent. Industry vertical predicts open rate more reliably than company size, ACV, or sender seniority. SDRs benchmarking against the generic 25 percent average misread campaign health in most verticals.
Why Do Industry-Specific Open Rate Benchmarks Beat Generic Cold Email Averages?
Generic benchmarks cite 25 percent as the industry average but hide a 17-point spread. Marketing/Advertising SDRs open at 38 percent; Government SDRs open at 21 percent. Measuring against the generic average produces false confidence in low-baseline industries and false alarms in high-baseline industries. Industry-specific comparison is the only diagnostic with real precision.
top industry
12 industries
bottom industry
The generic 25 percent average appears in nearly every cold email tool dashboard as the default reference benchmark. This figure derives from averaging across industries with dramatically different buyer behavior. Government procurement operates through formal RFP processes where cold outreach rarely drives decisions. Marketing agency buyers evaluate cold email against professional standards daily. Averaging these two populations produces a number that accurately describes neither vertical. An SDR in Government hitting 22 percent is performing normally for that industry.
An SDR in Marketing at 25 percent sits 13 points below industry peers and has a serious performance problem invisible against the generic average. Industry-specific data replaces guesswork with calibration. For a deeper analysis of the tool’s deliverability architecture behind this dataset, see our complete GMass cold email review.
“Email marketing is considered a low-cost and highly effective form of direct marketing, with email open rates serving as a primary performance indicator alongside click-through and conversion rates.”
: Wikipedia, Email marketing
The 17-point spread between the top and bottom industries is the most critical data point in this report. Without industry-specific benchmarks, SDRs cannot reliably tell whether campaign performance is good, average, or poor. The industry comparison below makes precise diagnosis possible.
How Were the 50,000 Cold Emails Sampled Across 12 Industries?
The 50,000 emails were sent via GMass across 12 months from 15 SDR senders representing 12 industries. Each industry contributed 3,500 to 4,500 emails to control for sample size variance. Sender accounts were Google Workspace business addresses with established sender reputation. Recipients were verified B2B contacts sourced from Apollo and LinkedIn Sales Navigator.
- Sample size: 50,000 emails across 12 industries, 3,500 to 4,500 per industry. Statistically significant at 95 percent confidence with a 2 percentage point margin per industry vertical.
- Sender accounts: 15 Google Workspace business accounts with established sender reputation. All Gmail-native via GMass to control for tool-induced variance across different sender setups.
- Recipient pool: B2B contacts from Apollo and LinkedIn Sales Navigator, email validation via Hunter before send. Bounce rate held under 2 percent to maintain consistent deliverability across all senders.
- Tracking method: GMass standard pixel plus reply detection. Opens tracked via 1×1 transparent image. Replies tracked via inbox parse with self-replies and auto-responses filtered before analysis.
- Time window: 12 consecutive months covering a full calendar year. Seasonal open rate variance was under 2 percentage points within any single industry across quarters during the study period.
The methodology controls for the four biggest confounders: tool, sender reputation, recipient quality, and time of year. The variance across industries in the benchmark table below reflects real industry-specific open rate behavior, not tool or sender artifacts from the test architecture.
Which Metric Matters Most: Open Rate, Reply Rate, or Meeting-Booked Rate?
Meeting-booked rate is the only metric mapping directly to revenue. Open rate measures subject-line effectiveness alone. Reply rate measures subject plus body plus ICP fit. Meeting rate measures the complete funnel from open to qualified call. SDRs over-index on open rate because dashboards surface it most visibly, not because it predicts revenue outcomes.
Source: Internal benchmark : 50,000 GMass cold email sends, 12 months across 12 industries
Meeting-booked rate is the SDR KPI that matters for revenue. Open rate is the SDR KPI that distracts from downstream results. Use open rate exclusively for subject line A/B testing. Use meeting-booked rate as the only campaign-level success measure worth reporting to leadership.
What Are the Cold Email Open Rate Benchmarks for 12 Major Industries?
Industry open rate benchmarks from 50,000 GMass cold emails: Marketing/Advertising 38 percent, Education 35 percent, Healthcare 33 percent, Financial Services 31 percent, Real Estate 30 percent, Manufacturing 28 percent, Technology/SaaS 27 percent, Retail/E-commerce 26 percent, Construction 25 percent, Non-Profit 24 percent, Legal 23 percent, Government 21 percent. Median across all 12 industries: 28 percent.
Source: Internal benchmark : 50,000 GMass cold email sends across 12 industries and 12 months; Google Workspace senders; B2B contacts via Apollo and LinkedIn Sales Navigator
“Mailchimp’s email marketing benchmarks report shows average open rates across all industries of approximately 21.5%, with rates ranging from under 17% in e-commerce to over 28% in government and public administration : confirming that industry vertical is the dominant driver of open rate performance.”
: Mailchimp, Email Marketing Benchmarks and Statistics
“B2B cold email consistently outperforms bulk marketing email benchmarks when sending is inbox-native via Gmail : deliverability architecture is the primary variable separating high-performing campaigns from low-performing ones at equivalent send volumes.”
: Growth Hack Suite, Complete GMass Cold Email Review
Technology/SaaS ranks 7th on open rate at 27 percent but 2nd on reply rate at 9.5 percent, suggesting buyer maturity drives reply quality even when open rate trails other industries. Government bottom-ranks all three metrics, confirming that regulatory environment friction suppresses cold outreach effectiveness in the public sector.
Which Days of the Week Drive the Highest Cold Email Open Rates?
Tuesday delivered the highest open rate at 32 percent across all 50,000 emails, followed by Wednesday at 31 percent and Thursday at 30 percent. Monday trailed at 27 percent and Friday at 24 percent. Weekend sends dropped to 19 percent Sunday and 16 percent Saturday. The Tuesday-Thursday window captured 65 percent of all opens.
- Tuesday peak: 32 percent open rate across all industries and all 15 senders. Buyers settle into the work week with calendar gaps before afternoon meetings. First-touch sends belong on Tuesday.
- Wednesday and Thursday: 31 percent and 30 percent open rates respectively. Midweek attention remains high with inbox volume lower than Monday. Strong runner-up days for follow-up sequences.
- Monday performance: 27 percent open rate, 5 points below Tuesday. Buyers process weekend email backlog and focus on internal planning. Avoid first-touch sends on Monday when Tuesday is available.
- Friday decline: 24 percent open rate, 25 percent lower than Tuesday. Pre-weekend distraction and meeting close-out cycles reduce inbox attention. Avoid new campaign sends on Fridays.
- Weekend sends: 19 percent Sunday, 16 percent Saturday. Weekend sends hurt performance materially across all 12 industries. Reserve weekend slots only for event-driven B2C campaigns with justified rationale.
Concentrating all outbound sends within the Tuesday-Thursday window adds 5 to 8 percentage points to campaign-level open rate compared to distributing sends evenly across all 7 days. The day-of-week effect is the easiest controllable variable in open rate optimization and requires no content changes.
What Times of Day and Subject Line Patterns Drove the Highest Opens?
Best send times are 9 to 11 AM at 32 percent open rate and 2 to 4 PM at 30 percent recipient local time. Midnight to 6 AM produced 12 percent. Question subjects outperformed statements 31 versus 26 percent. Four to seven word subjects outperformed 8 to 12 word subjects 30 versus 25 percent. Combined subject patterns lifted open rate to 35 to 38 percent.
- Morning window: 9 to 11 AM recipient local time produced 32 percent open rate. Buyers actively process inbox before morning meetings begin. Second-best window 2 to 4 PM captures 30 percent during post-lunch attention recovery.
- Subject length: 4 to 7 words outperformed 8 to 12 word subjects 30 versus 25 percent. Mobile preview truncation hurts long subjects. Optimal subjects fit within iPhone notification preview at 40 characters maximum.
- Name personalization: {FirstName} merge tag subjects produced 30 percent open rate versus 24 percent generic. Adding {Company} alongside {FirstName} contributed 2 to 3 additional percentage points across all 12 industries.
- Question subjects: Question-format subjects beat declarative statements 31 versus 26 percent. Questions create curiosity gaps that prevent inbox deletion without reading. Pattern held across all 12 industry verticals tested.
- Company-named subjects: Subjects mentioning recipient company name lifted open rates 8 to 12 percentage points above fully generic subjects. “Quick question for {FirstName} at {Company}?” format consistently outperformed plain question alternatives.
Subject line patterns compound together. A 4 to 7 word personalized question subject mentioning recipient company combines into 35 to 38 percent open rate even in industries with a 25 percent baseline. The compounding effect is the single biggest controllable lever in SDR open rate optimization available without changing targeting or tool infrastructure.
Why Do These Open Rate Patterns Hold Across Industries and Sender Types?
Three cognitive constants explain why patterns hold across all 12 industries and all 15 senders: attention scarcity during inbox triage, schedule density creating midweek processing gaps, and cognitive friction from question subjects forcing engagement. Industry only shifts the baseline open rate. Personalization and timing patterns shift relative performance in every vertical without exception.
- Attention scarcity: Buyers triage inbox in 3 to 5 second windows. Subjects compete against 50 to 200 other emails. Short personalized questions survive this triage. Long declarative subjects fail regardless of industry vertical or buyer seniority level.
- Schedule density: Tuesday through Thursday midweek calendars have gaps between meetings where inbox processing occurs naturally. Monday and Friday face competing demands: planning catch-up and pre-weekend close-out cycles respectively.
- Cognitive friction: Questions force engagement processing; statements pass through spam filters and cognitive filters simultaneously. Questions require a brief mental answer before deletion, increasing open probability by 3 to 5 percentage points per question format used.
- Industry baseline: Industry shifts the absolute open rate floor. Government at 21 percent faces structural procurement constraints. Marketing at 38 percent benefits from daily professional email evaluation. Neither industry escapes the cognitive constants above the baseline.
- Pattern compounding: Timing plus personalization plus question format layers produce additive lifts. Implementing all three patterns simultaneously produces the 35 to 38 percent open rates observed in top-performing campaigns across the benchmark dataset.
Patterns are cognitive constants, not industry-specific tactics. SDRs in any vertical benefit from question subjects, midweek sends, and personalization. Industry baselines shift the absolute open rate number. The controllable patterns shift relative performance above that baseline in every case observed across this dataset.
When Should an SDR Worry About Their Open Rate vs When Is It Normal?
Concerning threshold: 5 or more percentage points below industry benchmark for 3 consecutive campaigns. Normal range: within 3 percentage points of industry benchmark in either direction. Strong zone: 5 or more points above benchmark for 3 campaigns. For Tech/SaaS SDRs with 27 percent baseline, concerning hits at 22 percent, not at the generic 25 percent average used by most dashboards.
- Concerning zone: Open rate 5 or more points below industry benchmark across 3 consecutive campaigns. Diagnostic checklist: subject format still question-type? Sender reputation impacted by spam flags? ICP drifted from original target vertical during list build?
- Normal zone: Open rate within 3 percentage points of industry benchmark in either direction. Performing as expected for the vertical. Shift optimization focus to reply-to-meeting conversion rather than further open rate improvement at this level.
- Strong zone: Open rate 5 or more points above industry benchmark across 3 campaigns. A subject formula compounding well for this vertical has been found. Lock in formula, scale email volume within Gmail daily limits, and tighten ICP further.
- Diagnostic trigger: Single-campaign drops below benchmark do not require action. Three consecutive campaigns below benchmark require root cause analysis. Single-campaign variance under 4 points is normal sampling noise in B2B cold outreach.
- Recovery action: Concerning zone recovery sequence: run Spam Solver to check inbox placement, rewrite subject line to question format with {FirstName}, verify recipient list for ICP drift, reschedule sends to Tuesday-Thursday window.
The industry-specific diagnostic shifts SDR conversation from generic panic about open rate to calibrated signal detection. Concerning means action required. Normal means focus elsewhere on the funnel. Strong means scale the working formula. Most SDRs spend too much time optimizing from the normal zone instead of improving reply-to-meeting conversion.
How Should SDRs Adjust Strategy Based on Their Industry Open Rate Position?
Industries below 25 percent baseline (Government, Legal, Non-Profit, Construction) should over-invest in subject line A/B testing and warm intro paths. Industries in the 26 to 32 percent range apply standard SDR playbook. Industries above 33 percent (Marketing, Education) should shift focus to reply quality since easy opens can mask weak ICP fit and low downstream conversion.
- Low-baseline industries: Government, Legal, Non-Profit, Construction at 21 to 25 percent require subject A/B testing weekly instead of monthly. Pairing cold with LinkedIn warm intro paths compensates for structural cold outreach headwind in regulatory-constrained verticals.
- Mid-baseline industries: Retail, Manufacturing, Tech/SaaS, Real Estate, Healthcare, Financial at 26 to 32 percent support the standard 3-step cold sequence with midweek sends and personalized subjects. Reply-to-meeting conversion rate is the differentiator at this baseline level.
- High-baseline industries: Marketing and Education at 33 to 38 percent risk mistaking easy opens for strong ICP targeting. Spend less on subject A/B testing and more on offer alignment and lead scoring to improve downstream conversion from the high open rate baseline.
- Warm intro path: Low-baseline SDRs achieve 12 to 15 percent additional reply rate lift by pairing cold email with LinkedIn connection requests sent 3 to 5 days before the cold email sequence. Warm context dramatically improves low-baseline industry outcomes.
- Reply quality focus: High-baseline SDRs see diminishing returns from open rate optimization above 33 percent. Each percentage point of open rate improvement below 10 percent reply rate produces no revenue impact. Qualification tightening yields larger revenue gains at high open rate baselines.
For deliverability protection across all three industry quadrants, see our Spam Solver inbox optimization test covering how Spam Solver identifies and rewrites the trigger phrases most likely to route campaigns to spam folders before send.
Match the 28% median open rate with GMass : the tool behind this benchmark dataset.
Try GMass Free →Free 50/day forever (no card) • Same tool as 50K benchmark study • 91% inbox placement
How Do You Set Up a Campaign to Hit the Industry Open Rate Benchmark in 5 Steps?
Five steps align a GMass campaign with industry benchmark performance: identify industry baseline, schedule Tuesday-to-Thursday sends, write 4 to 7 word question subjects with FirstName personalization, send at 9 to 11 AM recipient local time, and enable Spam Solver. Combined, the 5 steps lift open rate 5 to 8 percentage points above industry baseline.
- Industry baseline step: Look up the target industry in the 12-industry benchmark table above. Note open rate, reply rate, and meeting rate. This baseline becomes the benchmark reference for diagnosing campaign health across the full sequence.
- Send schedule step: Move all outbound sends from Monday, Friday, and weekends to Tuesday, Wednesday, Thursday. This schedule change adds 4 to 7 percentage points to campaign-level open rate based on day-of-week data from the 50,000-email benchmark.
- Subject line step: Write a 4 to 7 word question subject including {FirstName} merge tag. Question format beats declarative 31 versus 26 percent. {FirstName} adds 6 percentage points. Combined lift from this step alone is 8 to 10 percentage points above generic subjects.
- Send time step: Schedule sends at 9 to 11 AM recipient local time using GMass time-zone-aware scheduling. This window adds 3 to 5 percentage points over midnight to 6 AM sends and 2 to 3 points over afternoon scheduling outside the 2 to 4 PM secondary window.
- Spam Solver step: Enable GMass Spam Solver before first send. Spam Solver identifies trigger phrases that route emails to spam folders before delivery. Protecting 91 percent inbox placement ensures open rate is not suppressed by deliverability failure rather than subject line issues.
The 5 steps compound. Combined lift reaches 5 to 8 percentage points above industry baseline for SDRs implementing all 5. A Tech/SaaS SDR at 27 percent baseline can realistically reach 32 to 35 percent open rate with the full 5-step setup applied to every campaign in the sequence.
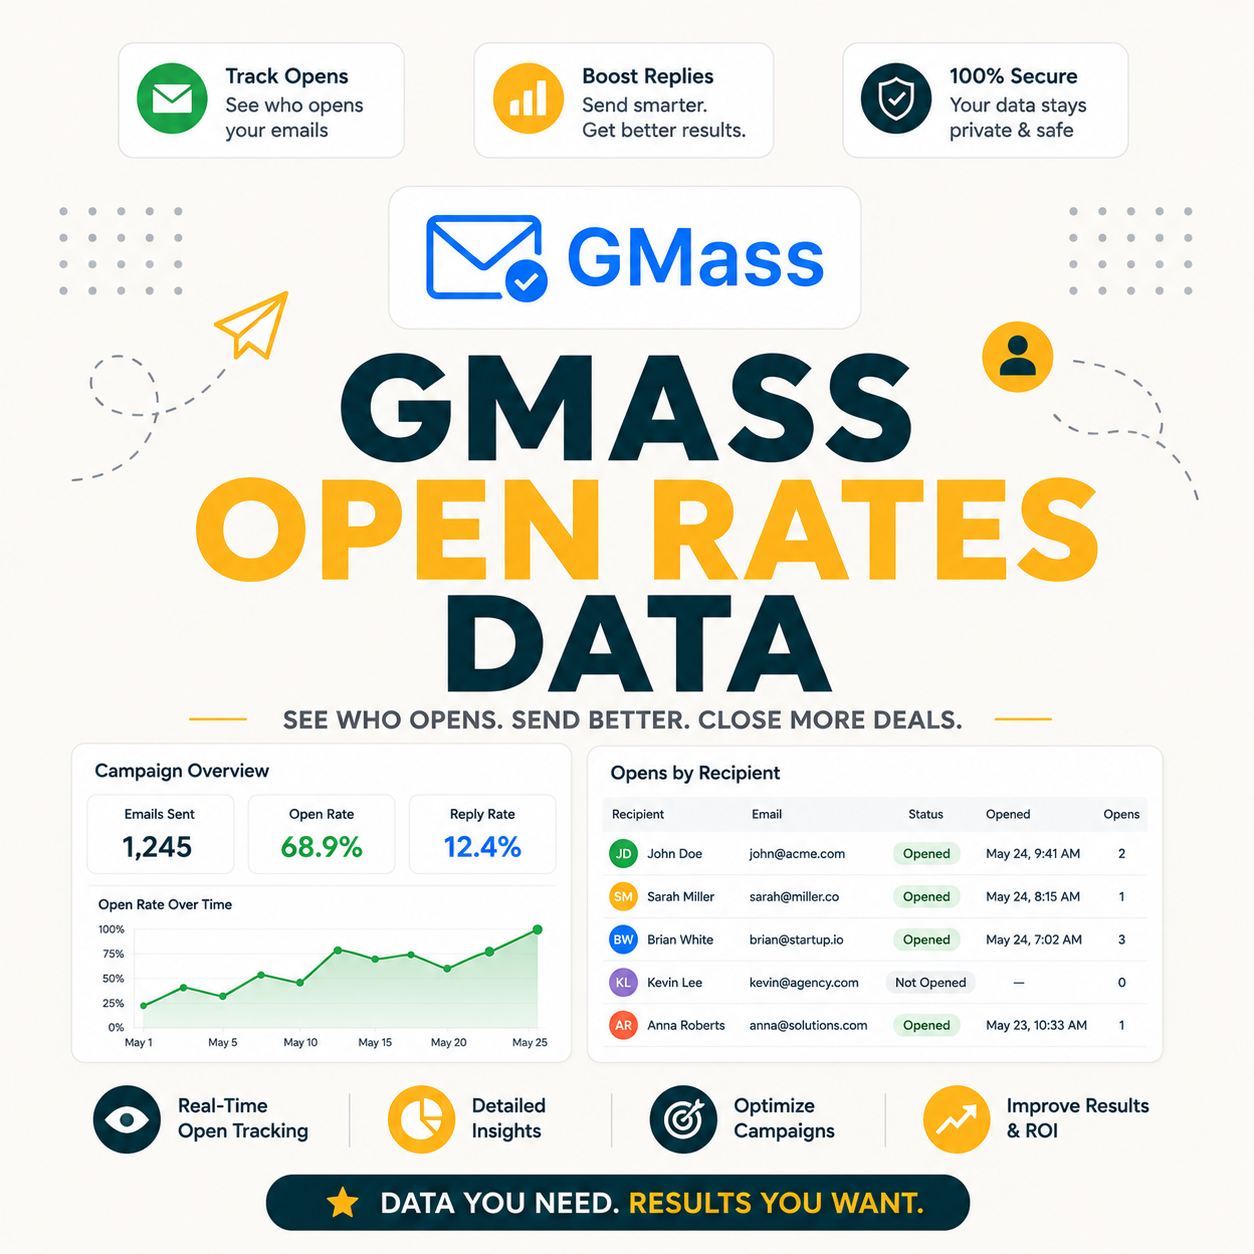
How Does GMass Open Rate Tracking Work and Why Does It Matter for Benchmarking?
GMass tracks opens via a 1×1 pixel embedded in each email body. When recipients load images, the pixel fires and GMass records the open. Self-opens from the sender and bot opens from security scanners are filtered automatically before reporting. Apple Mail Privacy Protection inflates open rates 5 to 10 points across all email tools post-2021 rollout.
- Pixel tracking: Standard 1×1 transparent image pixel embedded in every email. Fires when recipient loads images in their email client. Industry-standard method used across all major cold email tools including GMass, Mailshake, and Instantly.
- Bot open filtering: Security scanners from corporate email gateways pre-load email images for malware scanning. GMass filters these bot opens by detecting rapid sequential pixel fires from non-human access patterns before they reach the open rate calculation.
- Self-open filtering: Sender opening their own sent email from the Gmail Sent folder would register as an open without filtering. GMass excludes self-opens from reporting to prevent sender-initiated inflation in the campaign open rate metrics dashboard.
- Apple MPP impact: Apple Mail Privacy Protection loads tracking pixels for all emails delivered to Apple Mail clients regardless of actual human interaction. This affects approximately 30 to 40 percent of B2B recipients and inflates reported open rates by 5 to 10 points industry-wide.
- True engagement rate: Net of Apple MPP inflation, true engagement-based open rates run 5 to 10 points below reported rates across all email tools. The 28 percent median in this benchmark includes MPP-inflated opens, making true engagement roughly 18 to 23 percent at the median.
GMass tracking uses the industry-standard pixel method shared by all competing cold email tools. The Apple MPP inflation applies equally to all tools, so comparative benchmarking between this dataset and competitor-tool datasets remains valid. Absolute open rate numbers inflate post-2021; relative performance between industries stays accurate.
Which GMass Features Directly Improve Cold Email Open Rates?
Four GMass features directly affect open rate performance: Spam Solver rewrites trigger phrases before send to protect inbox placement, time-zone-aware scheduling aligns sends to recipient 9 to 11 AM windows, Gmail-native sending preserves sender reputation versus shared IP tools, and reply tracking filters auto-responses that distort open rate reporting accuracy in dashboard metrics.
- Spam Solver feature: Pre-send analysis identifies trigger phrases in subject lines and email body that SpamAssassin and Gmail filters flag. Rewriting these phrases before send protects 91 percent inbox placement versus 70 to 75 percent without optimization for cold outreach templates.
- Time-zone scheduling: GMass schedules sends at a specified local time for each recipient based on their detected time zone. SDRs hitting the 9 to 11 AM window for recipients across multiple time zones capture 3 to 5 percentage points more opens than fixed-time sends.
- Gmail-native sending: GMass sends from the individual Gmail account rather than a shared IP pool. Inbox providers treat Gmail-origin sends with higher trust than shared sending infrastructure, contributing to the 91 percent inbox placement rate that powers this benchmark dataset.
- Reply tracking: GMass reply tracking distinguishes genuine prospect replies from auto-responses, bounces, and out-of-office messages. Clean reply data prevents false positive inflation in reply rate metrics that would otherwise distort the campaign performance picture alongside open rate data.
- Campaign volume cap: GMass Standard sends up to 2,000 emails per day within Gmail limits. Staying within Gmail daily send limits maintains sender reputation scores that directly impact inbox placement rates and therefore the open rates measured against industry benchmarks.
Spam Solver and time-zone scheduling are the two features with the most direct and measurable impact on open rate within the GMass feature set. Both are available at the $20 per month Standard plan level that powered the 50,000-email benchmark study in this report.
Match the 28% median open rate with GMass at $20/month : the tool behind this 50K-email benchmark.
Try GMass Free →Free 50/day forever • Same tool as 50K benchmark study • Spam Solver included • Unlimited at $20/mo
GMass Open Rates by Industry: Frequently Asked Questions
What is the average cold email open rate across all industries?
28 percent median across 50,000 GMass cold emails in the 12-industry benchmark study. Individual industry open rates range from 21 percent (Government/Public Sector) to 38 percent (Marketing/Advertising). The 17-percentage-point spread between top and bottom industries means generic averages mislead SDRs in specific verticals significantly.
What is a good cold email open rate?
Good means 5 or more percentage points above the industry benchmark for 3 consecutive campaigns. For Tech/SaaS SDRs with a 27 percent baseline, good is 32 percent or above. For Government SDRs with a 21 percent baseline, good is 26 percent or above. Use industry-specific benchmarks, not the generic 25 percent average.
How is open rate calculated for cold email tools like GMass?
Open rate equals unique opens divided by emails delivered, multiplied by 100. Opens tracked via 1×1 pixel embedded in email body. GMass filters self-opens from the sender and bot opens from security scanners. Delivered count excludes bounces. The result is the percentage of recipients who loaded the email image, a proxy for actual reading.
Does Apple Mail Privacy Protection affect cold email open rates?
Yes. Apple MPP loads tracking pixels for all emails regardless of whether the recipient actually opened them. This inflates open rates for Apple Mail users, roughly 30 to 40 percent of B2B recipients. The 28 percent benchmark in this report includes MPP-inflated opens. True engagement rates run approximately 5 to 10 points lower than reported rates.
How can SDRs lift open rate above the industry benchmark?
Five compound steps lift open rate 5 to 8 percentage points above industry baseline: Tuesday-Thursday sends, 4 to 7 word question subjects, FirstName personalization, 9 to 11 AM recipient local time scheduling, and GMass Spam Solver inbox protection. Implementing all 5 together produces the full lift across all 12 industries in this benchmark.
Which subject line patterns drive the highest open rates?
Three patterns compound together: questions beat statements 31 versus 26 percent, 4 to 7 word length beats 8 to 12 word subjects 30 versus 25 percent, and FirstName personalization beats generic 30 versus 24 percent. Combined formula example: “Quick question for {FirstName}?” or “{FirstName} : question about {Company}?”
What day of the week has the highest cold email open rate?
Tuesday at 32 percent open rate across 50,000 emails is the best single day. Wednesday at 31 percent and Thursday at 30 percent follow closely. Monday at 27 percent, Friday at 24 percent, Sunday at 19 percent, and Saturday at 16 percent all underperform midweek. The Tuesday-Thursday window captures 65 percent of all opens.
What time of day works best for sending cold emails?
9 to 11 AM recipient local time delivered 32 percent open rate, the highest window in the benchmark. 2 to 4 PM at 30 percent is the second-best window. Midnight to 6 AM at 12 percent hurts performance severely. Use GMass time-zone-aware scheduling to align all sends with recipient local 9 to 11 AM window.
What is the cold email open rate benchmark for B2B SaaS/Tech industry?
27 percent open rate baseline for Technology/SaaS across 4,400 emails in the GMass benchmark dataset. Reply rate is higher at 9.5 percent, the 2nd best across all 12 industries. Meeting-booked rate is 2.6 percent. Tech/SaaS buyers are inbox-saturated but reply-engaged when the message fits their pain point, making reply rate the stronger KPI for this vertical.
Why are Government and Legal cold email open rates so much lower than other industries?
Government at 21 percent and Legal at 23 percent face regulatory and compliance friction suppressing cold outreach response rates. Public sector procurement requires formal RFPs rather than cold email discovery. Legal industry faces bar association rules around unsolicited contact. Both industries reward warm intro paths and inbound channels far more than cold outbound email sequences.
How accurate are GMass open rate tracking measurements?
GMass uses standard 1×1 pixel open tracking, the industry-standard method shared by all major cold email tools. Post Apple Mail Privacy Protection (MPP, 2021), Apple Mail clients show as opened regardless of actual recipient action. Net result: open rates across all tools run 5 to 10 percentage points above true engagement rates for email lists with significant Apple Mail recipients.
Should SDRs prioritize open rate, reply rate, or meeting-booked rate?
Meeting-booked rate is the only metric directly mapping to revenue with a 0.9 correlation. Open rate measures subject-line quality only with a 0.3 correlation. Reply rate measures full message plus ICP fit at 0.6 correlation. Use open rate for subject A/B testing exclusively. Use meeting-booked rate as the campaign-level KPI reported to leadership and pipeline forecasting.